 |
| MCX COPPER |
 |
| MCX COPPER 2 |
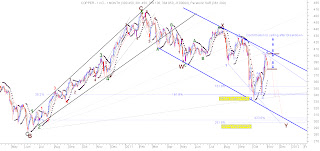
MCX copper chart is my previous prediction which i have told u about this trend , but recent chart is MCX Copper2 which indicates
correction pattern may be ABC wave, still i am not sure but we should
have keep in mind about these two patterns . If recent fall will make to
finished in 5 wave in the levels of 365 and any big bounce back or
bullish candle pattern will indicate 2 nd wave that means bull has been
started .
In weekly chart Big white candle with high volume indicates copper should not close below 360 levels and onwards bull should continue . lets see.
In weekly chart Big white candle with high volume indicates copper should not close below 360 levels and onwards bull should continue . lets see.
No comments:
Post a Comment