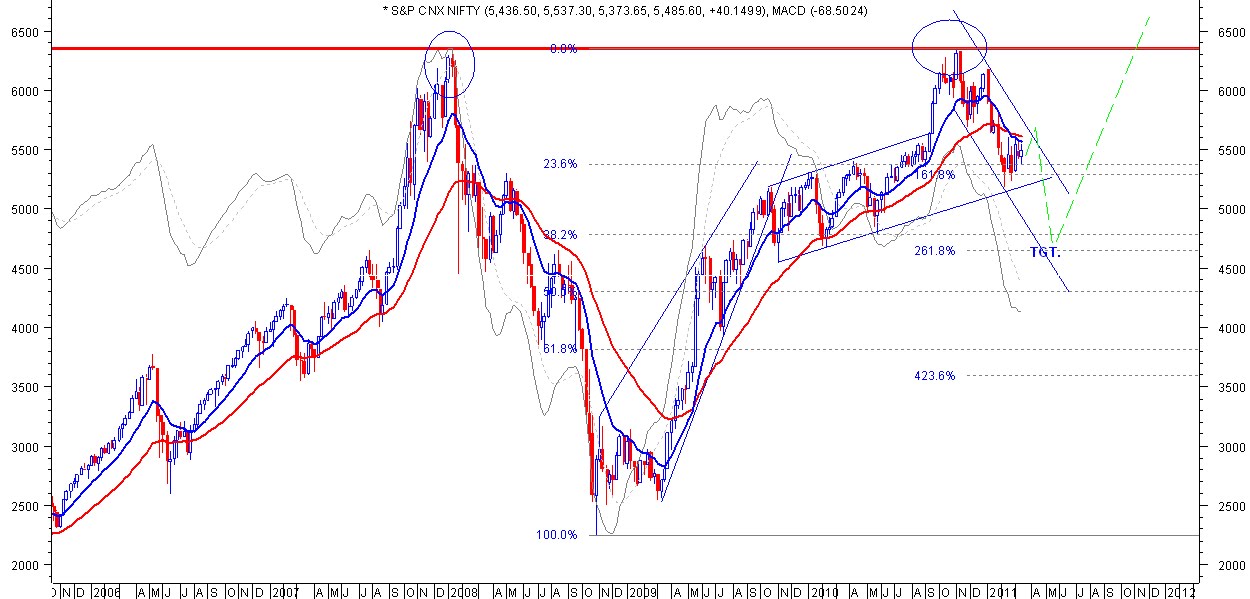
This time NIFTY is taking support near 5400 levels at weekly chart according to fibonacci analysis. in daily chart -MACD indicates some kind of bullish above 5565 levels to 5800 levels. so at this time price line is being trade in between trading range thats why we are in upper stage of the trading range.
Double top in weekly chart indicates bearish for longer term . but i am not sure because 5 wave pattern may be completed near 4700-4800 levels according to fibonacci strong support levels.
so lets see.
