 |
| MCX Copper |
|
| |
|
|
|
 |
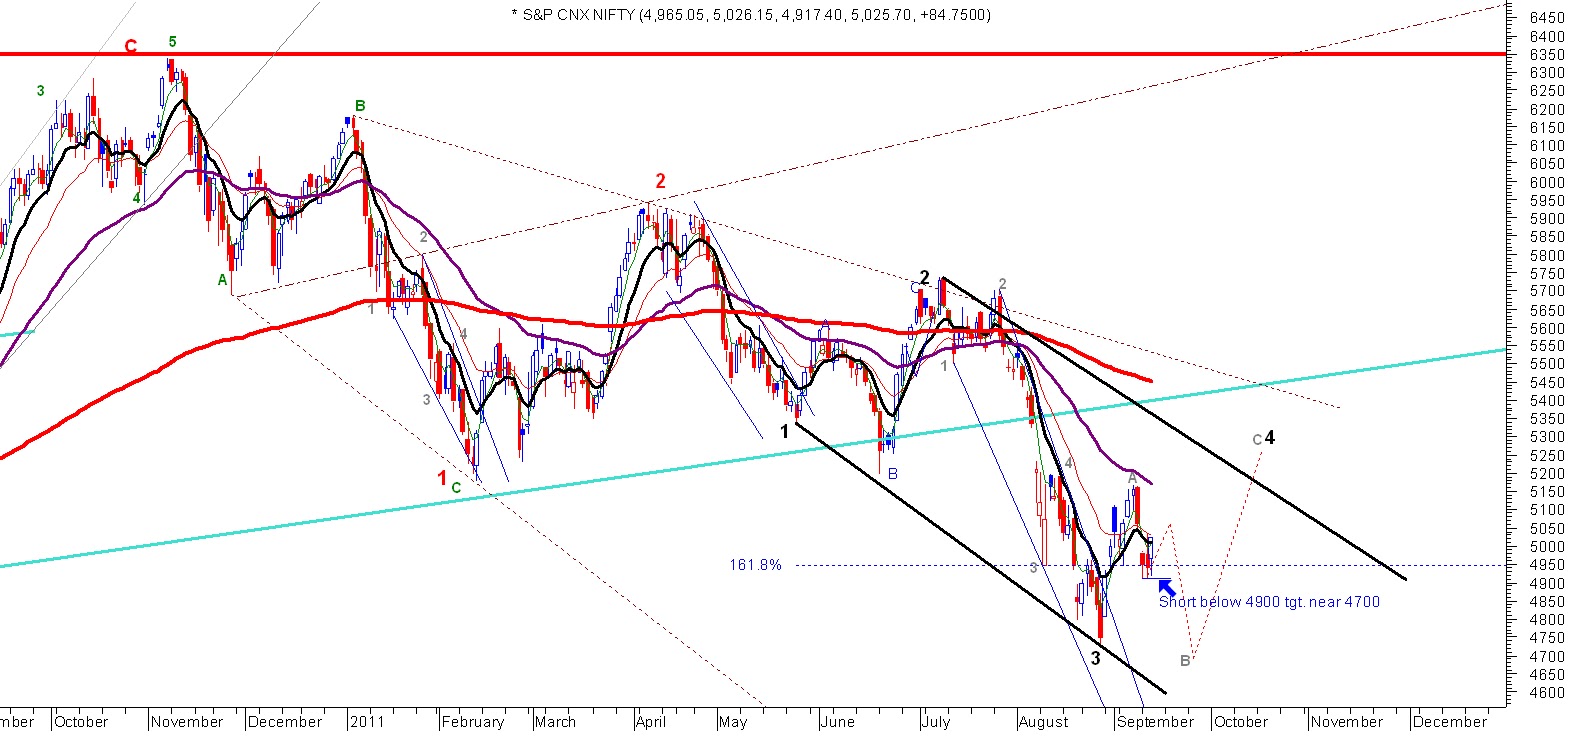
| Dow Transportation Avg. |
Dow Transportation Avg.---- As i told price line could take support
near previous low then rise. so at this moment Bullish candle pattern
indicates more bullish ahead with sl recent low which is indicated in
black horizontal line in chart. and i think 1st wave may be completed
near previous high of C wave then we could see some kind selling
pressure at higher levels for 2nd wave . i think C wave should completed
near 5100-5150 levels in near term.
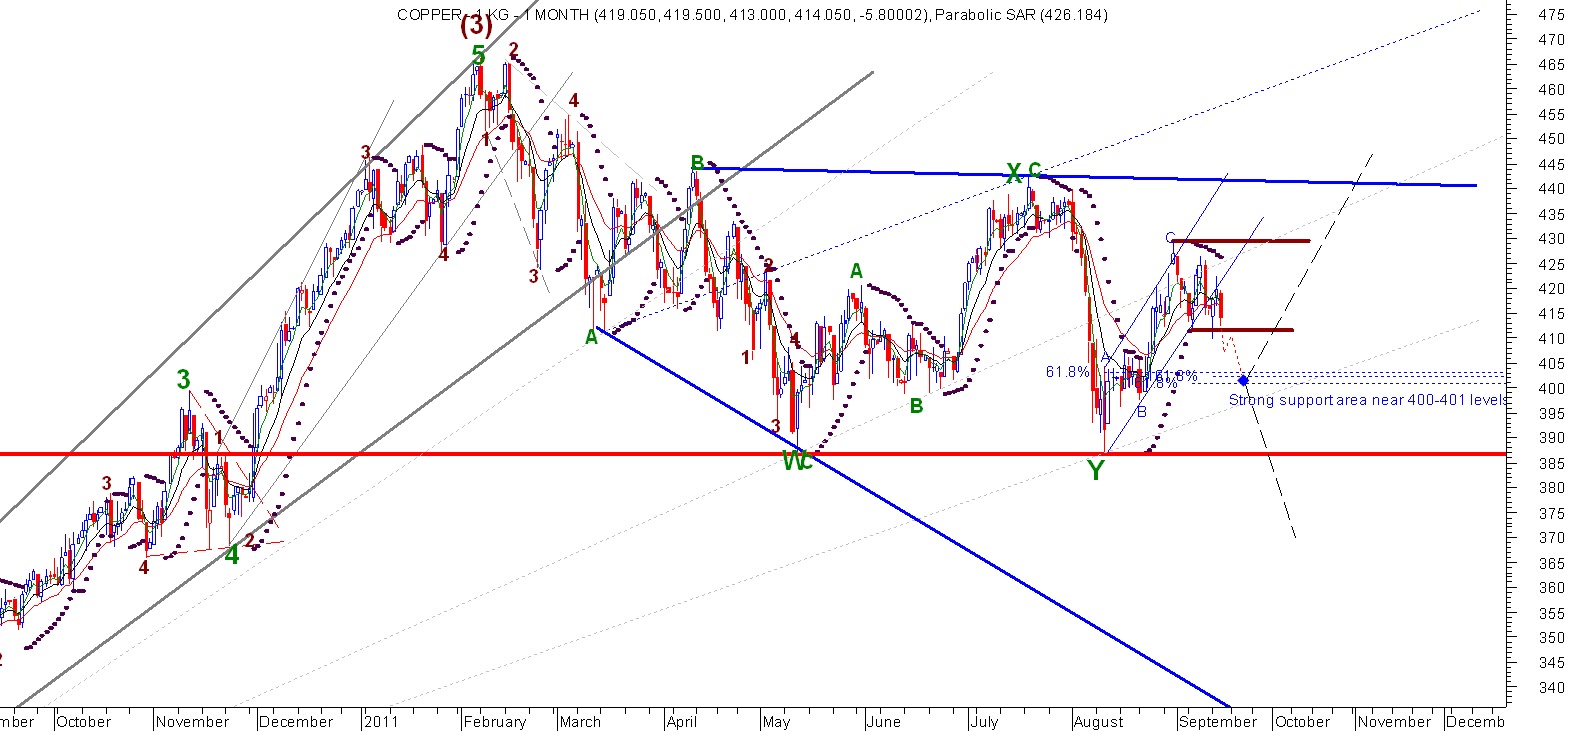
MCX Copper------- Copper price line has been breakdown previous
support 411.80 levels which indicates it should touch 400 levels in 5
wave with sl 426.5 as i think. Copper's trend is not clear as we know
that still its in bearish mode. if it falls below 387 levels then we
will see more down trend pattern . but according to Dow ,EURUSD as well
as Nifty all are indicating that price line may fall near 400 levels
then rise above 430 levels. if it happens then huge uptrend pattern will
see in near future.