US Dollar
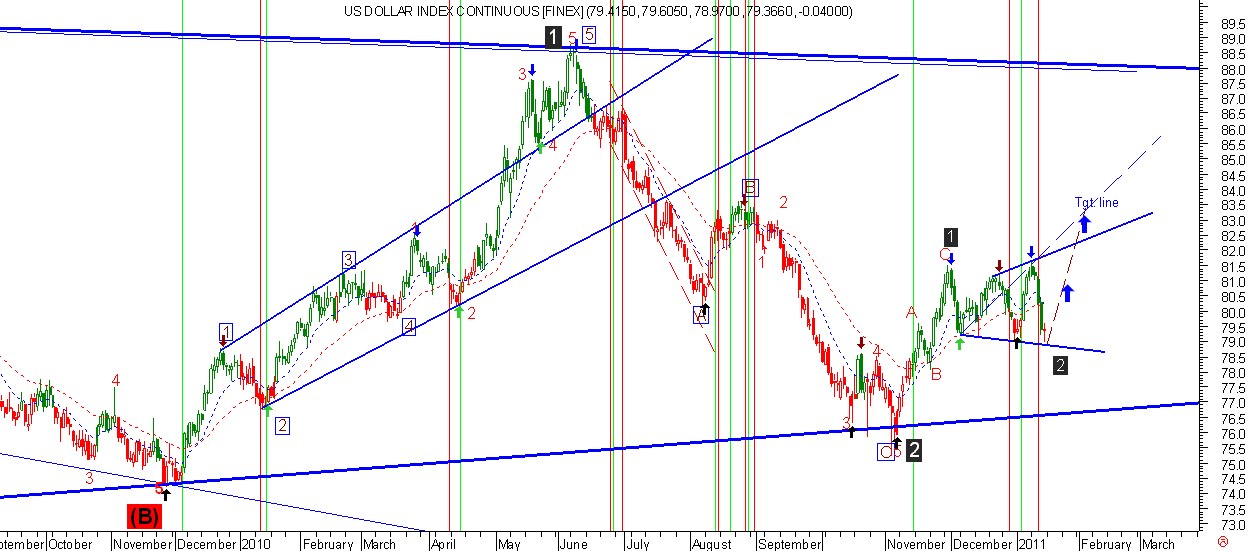 this Broadening Triangle pattern indicates bullish , if this pattern happens the we will see more bullish in ahead
 DOW

This Wolf wave pattern suggests bullish may be completed at any time and should convert in bearish pattern .
MCX Copper
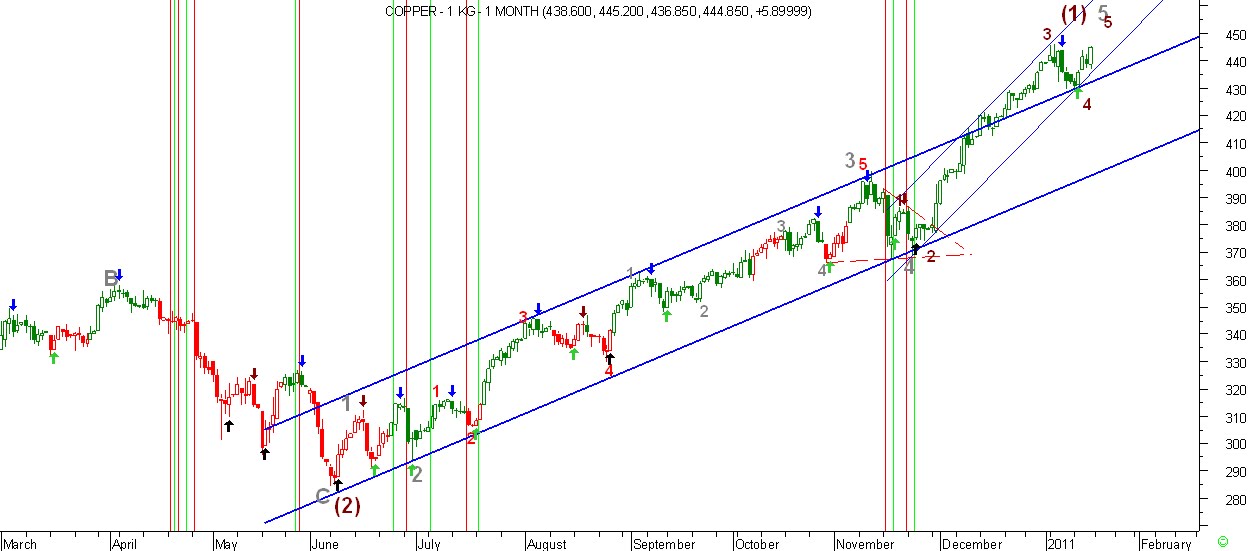 After huger rally from lower levels 290 which is the sign of bullish but at this time All patterns will be completed near 448-51 levels as i think. so i would to suggest square off all long position near this levels. and wait for creating short position

