 |
| MCX COPPER |
 |
| COMEX COPPER |
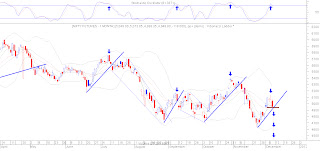
I was wrong about my previous prediction but at that time i said bullish above 402 levels in MCX. Overall pattern is not still clear for longer term pattern according to me where my thinking says copper may go higher high from current levels due to breakout in H&S pattern happened in weekly chart of RSI for the Tgt. of 450-60 in MCX and in COMEX near 4.20 levels. Comex Copper chart clear indicates for bullish after small correction happened may be near 390-385 levels in MCX . That's why i am just looking for a small correction but My mind is still open to taking both position . Lets see.
 |
10 YEAR TREASURY NOTE
|
Breakdown below 129.50 levels indicates 126.5 levels in few days and this is the positive for US market or Equity market.


