Friday, November 18, 2011

NIFTY SPOT

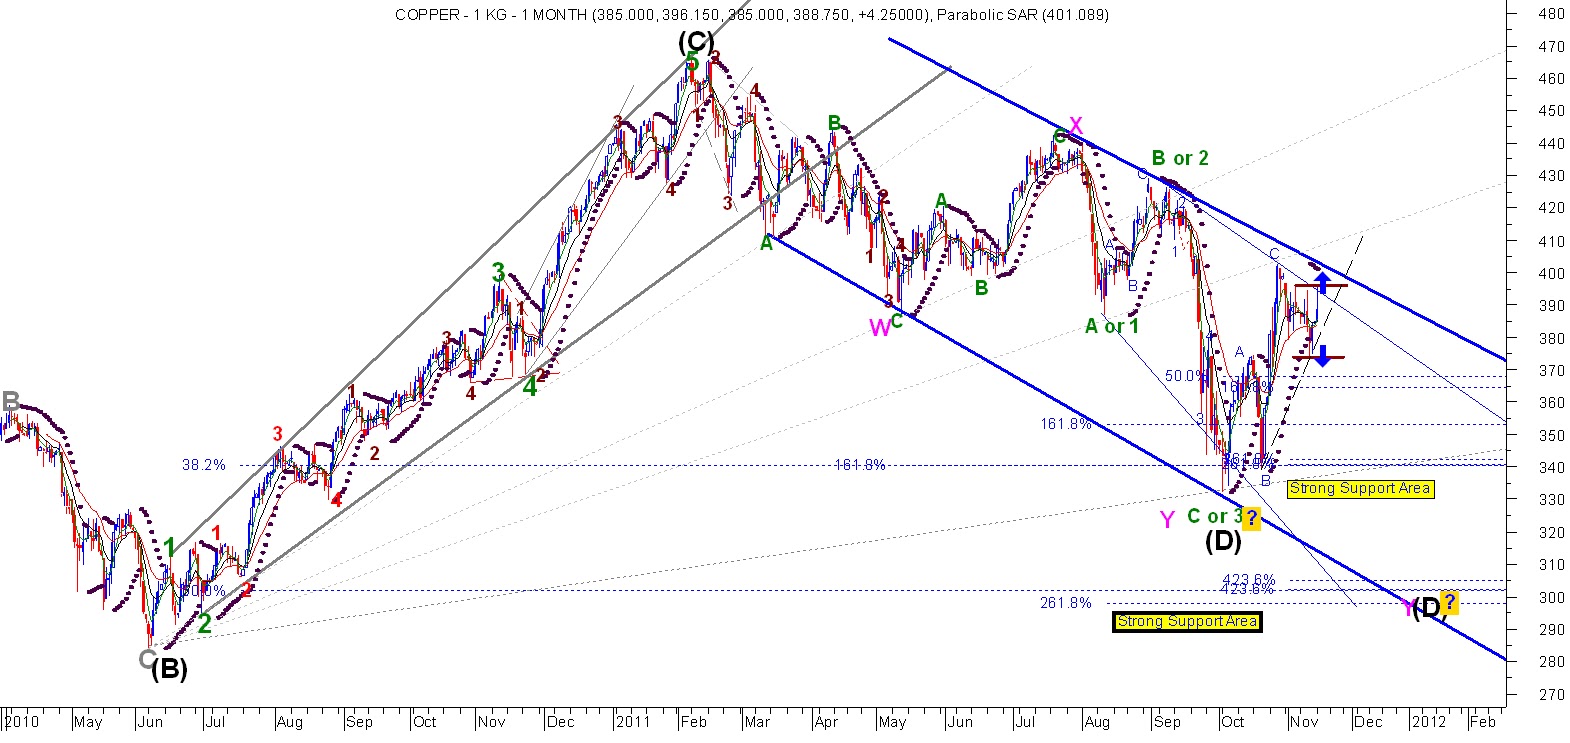
4900 levels has been touched as i told before . and now onwards i think we should stay in buy position instead of making short with sl 4720 . After completed 5 wave downside pattern in indicated in black number which indicates for ABC wave in upside . so we have completed A and B waves pattern and C wave should be near 5400 or 6000 levels or depending  due to positive divergence in MACD, RSI .

USDINR is trading at 51.40 levels which is above my expectation  but indicators like MACD, RSI all are giving negative divergence so most probably we may see some kind of sell off pattern and also in US Dollar

Wednesday, November 16, 2011

USDINR, NIFTY

USDINR

NIFTY SPOT
4900 levels as a strong support as i told before .In today Another chart pattern is in my mind which is--- 5 wave pattern of C wave for the tgt. of 2000 levels .

              1st pattern------ if nifty breaks 4720 levels then we may see strong strong strong support levels  near 4400 , then see huge uptrend pattern.

              2nd pattern----- if nifty doesn't break 4720 levels and back to 6300 or higher that levels the downside tgt. will be 3600-3700.

              3rd pattern------ if nifty doesn't break 4720 levels and back to 6000 levels then fall, Tgt. will be 2000 level or 2008 year low.


USDINR---- It seems like Broadening Triangle formation which may be completed near E wave as i indicated in chart and that could be 2nd wave . if it is true then sure my 3rd pattern in Nifty will be happened .

Lets see.

Tuesday, November 15, 2011

MCX COPPER

MCX COPPER
Copper has been rebound from 374 levels to 396 levels which was unexpected as my thinking so at this levels if Copper price line will go above 396.50 for the Tgt. of 408-409 levels on upper side then may be happened a good correction at ABC wave method. But if price line will breakdown below 374 levels then we may see a good correction in 5 wave pattern which could be 5th wave of Y wave for the Tgt. of  340--300 levels. with sl 396 levels.

Thursday, November 10, 2011

Dow Transport avg., 10 year Treasury Note , MCX Lead

DOW Transport Avg.

10 year Treasure Note

MCX Lead
10 year treasury note indicates fresh bullish pattern has been started that means more bearish pattern may see on Dow Transport Avg. and MCX Lead indiactes 5 th wave has been started and may be completed near 85-86 levels which is good levels for adding more buy position for the longer term trend with sl 78. or wait for confirmation in pattern.

Wednesday, November 9, 2011

NIFTY FUT. 1hr. chart

NIFTY FUT.
At this levels i think if nifty cross 5333 levels so we should go buy but before it should not touch 5270 levels  then the Tgt. of 5400 levels . 

MCX COPPER

MCX COPPER Daily chart

MCX COPPER 1hr. chart

Copper did not touch below 380 levels and trading in trading range of 10 points so at this levels i think we should go to buy at this levels with sl 381 and Tgt. would be 406/409 levels . if the price line will be crossed 381 levels then we should go short for the tgt. of 365 levels. Daily chart indicates --- 2 long white candle are giving support and yesterday Doji pattern indicates bullish above 391.85 which is the high of Doji candle.

Saturday, November 5, 2011

MCX COPPER

MCX COPPER

MCX COPPER 2
MCX copper chart is my previous prediction which i have told u about this trend , but recent chart is MCX Copper2 which indicates correction pattern may be ABC wave,  still i am not sure but we should have keep in mind about these two patterns . If recent fall will make to finished in 5 wave in the levels of 365 and any big bounce back or bullish candle pattern will indicate 2 nd wave that means bull has been started .

 In weekly chart Big white candle with high volume indicates copper should not close below 360 levels and onwards bull should continue . lets see.