|
| 1 HR. NIFTY CHART |
|
Nifty's price line didn't cross the previous low and closed above lower
trend line which indicates bullish signal for completing of B wave till
the levels of 4175-4200 . but i think we should be cautious at higher
levels , may be 1st wave has been extended . Then it may be go up near
5400 levels
 |
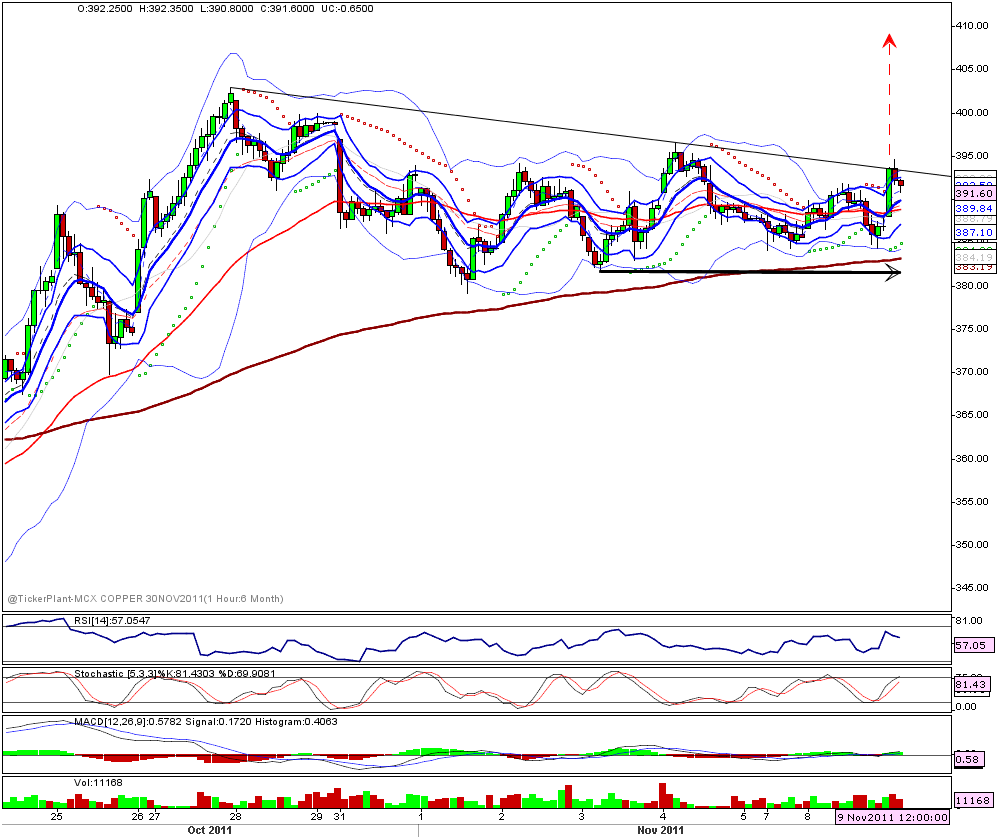
| MCX COPPER |
Bullish candlestick pattern with higher volume signals bull may be
extended near 380-385 levels in few days with sl 339 levels. which may
be C wave as i indicated in chart of last wave of correction pattern. so
we should have to wait for some kind of correction movement at this
levels ( may be good buying levels 345-51 ).
 |
| DOW TRANSPORT AVG. |
1st wave has been completed and B wave is continuing .
 |
| USDINR |
I am very confused to Analyze the longer term trend of USDINR but yes
in short term i am sure we should look some kind of correction pattern
till the levels of 47-48 after completed 5 wave .