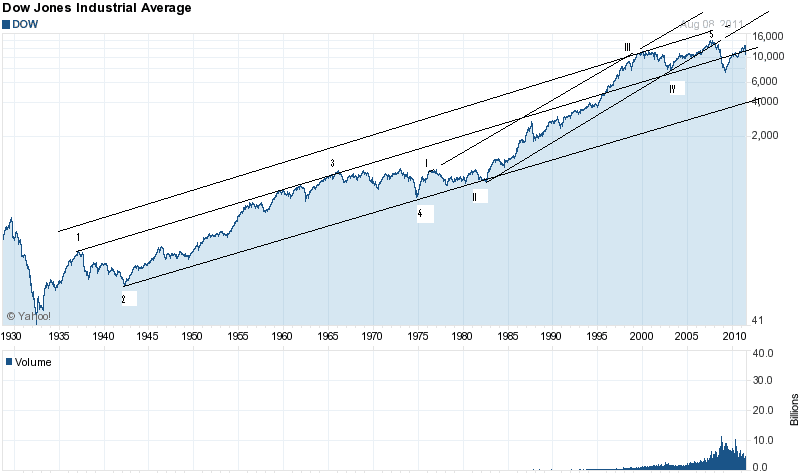
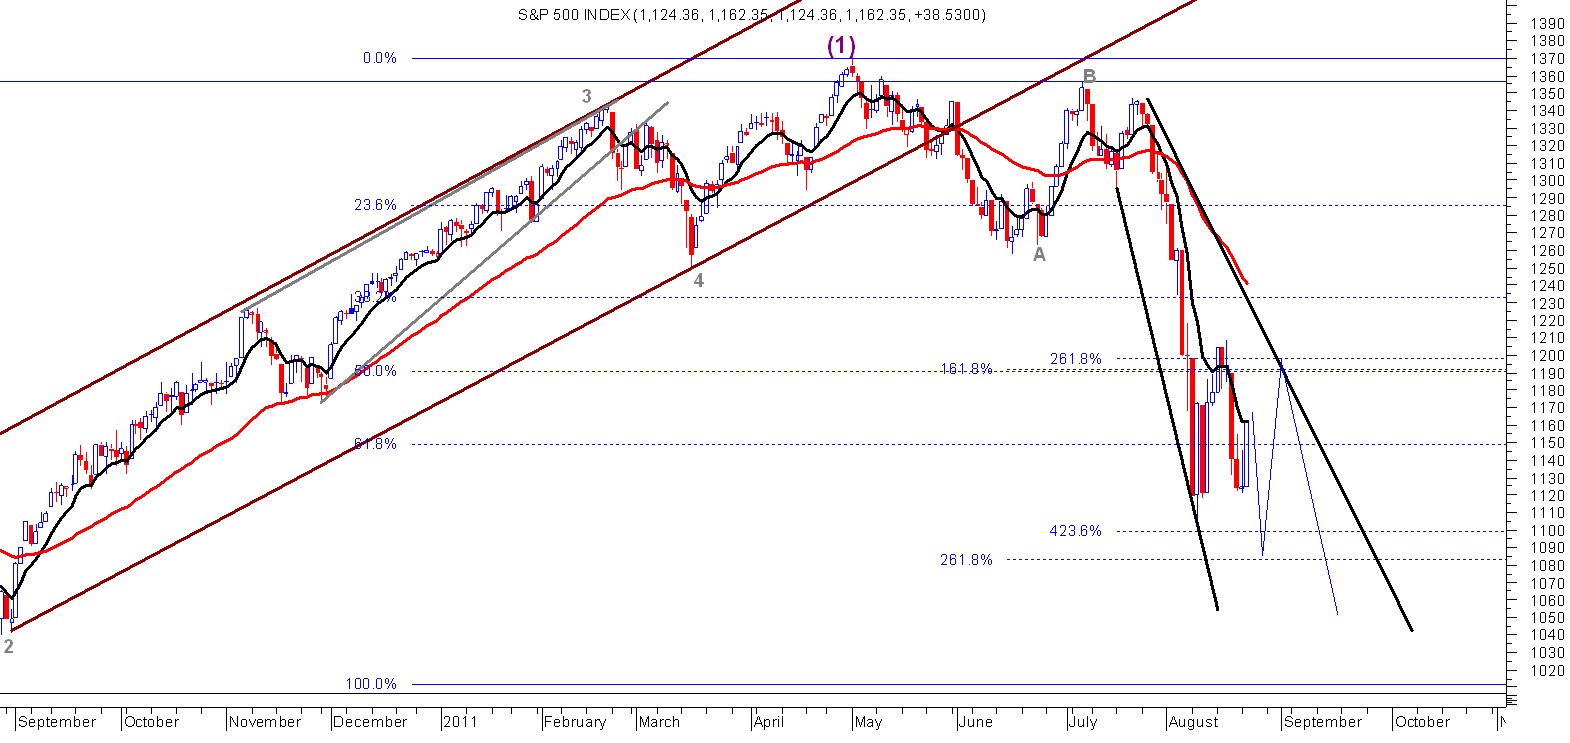
s we have seen , before EW theory has given signal Double dip recession when Dow is trading at 9670 levels after completed B wave of B wave according to Robert Prechter for the longer term . see one thing i just want to add EW theory is giving the direction of trend for further movement not for buying as well as selling . and u can analyze particular in Index chart , not for stocks . So u have to add position according to ur indicator which u have followed after getting confirmation in Trend. that wil be easy to get some profit in the market. I have seen most of the people said EW theory is nothing , this is BAKBAAS but they don't know how could it use or less knowledge to get identify the wave and it also use on shares,index etc. as like indicator for buying and selling . i just want to say this is not a easy theory as u have thinking ,there is if and but also. But in IF and BUT u have to find out which wave is right after learned this theory.
According to me i am just confirm the trend then go for indicators to add buying as well selling. This is the only one theory which could give signal for loger term view in the market as of my knowleadge still i am in learning stage.
And after completed B wave i think US market will give bailout package near C wave level or some days before so that Dow may recover from 5200 levels to 14500--15000 again which will be the B wave in ABC wave method . and in that rally Emerging market will get more benefit than US market. Thatswhy they are depending upon totally on Emerging market or BRIC countries.
i just want to express about EW theory which is written in above not like speech or advice for u have to follow.

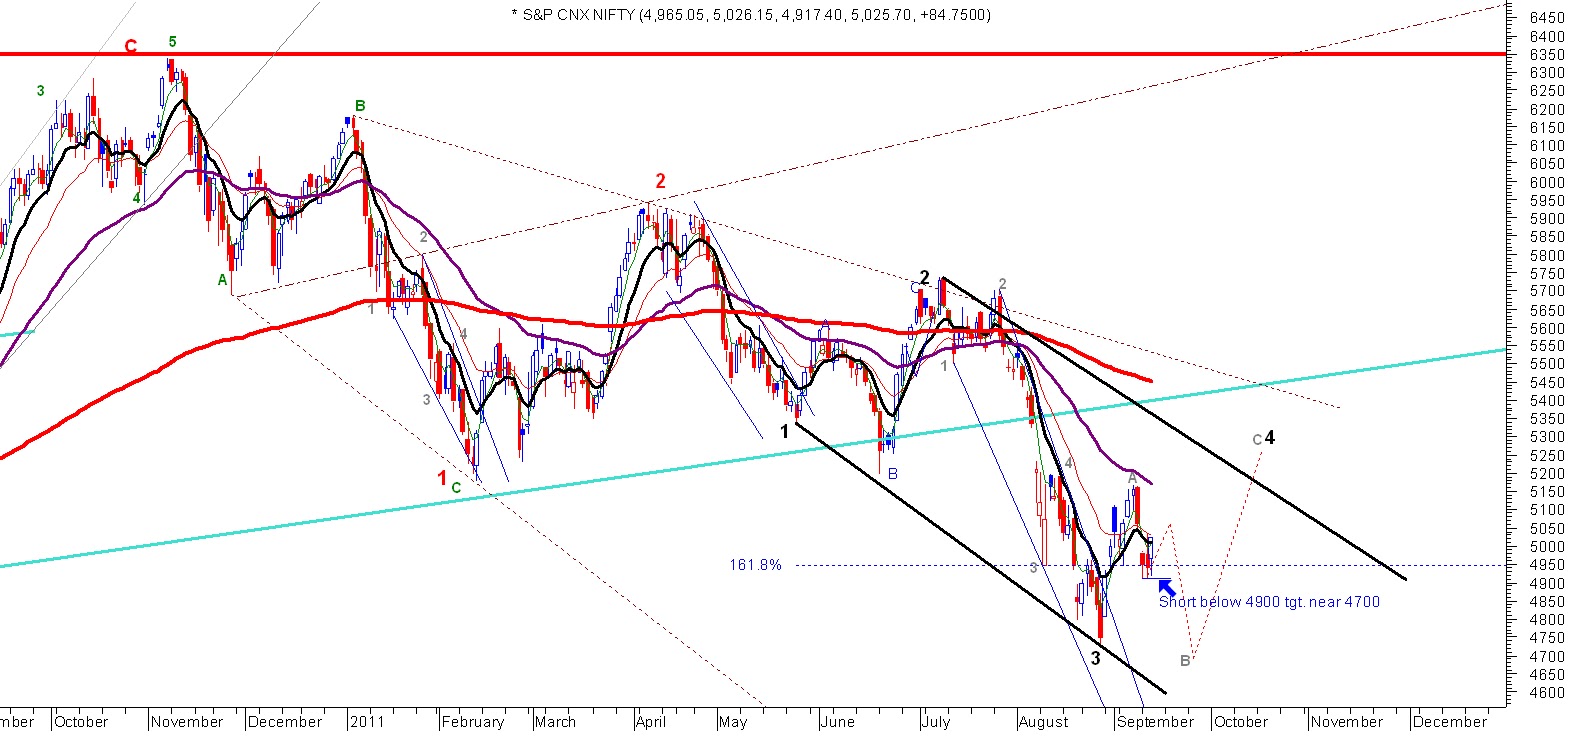
 Positive divergence in MACD indicates bullish as well as in EW theory also. at this time i am just thinking nifty may fall from 5000 levels to 4950 levels then upward till 5150-5170 levels in 5 wave. which may be end of the total rising pattern from lower levels.
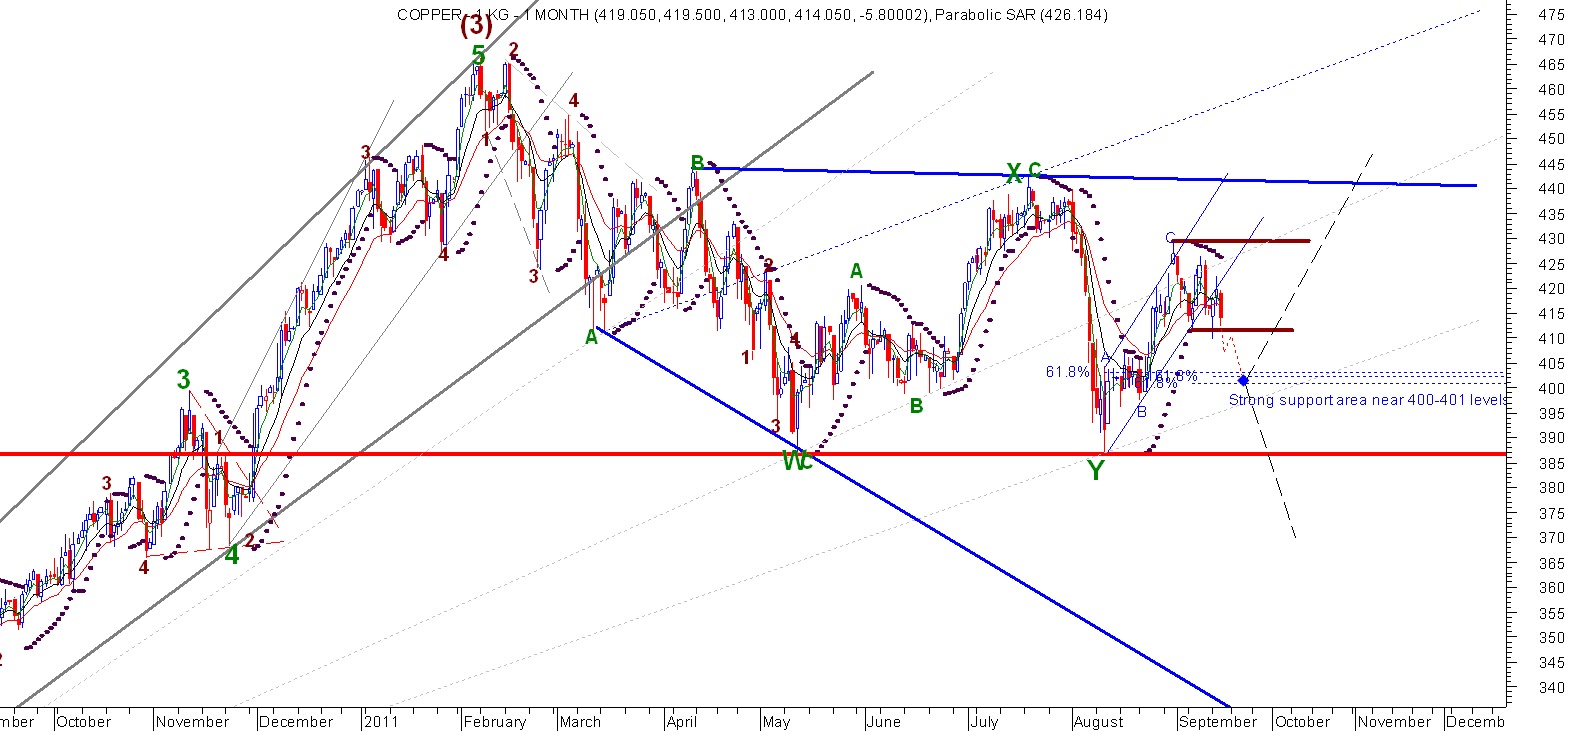
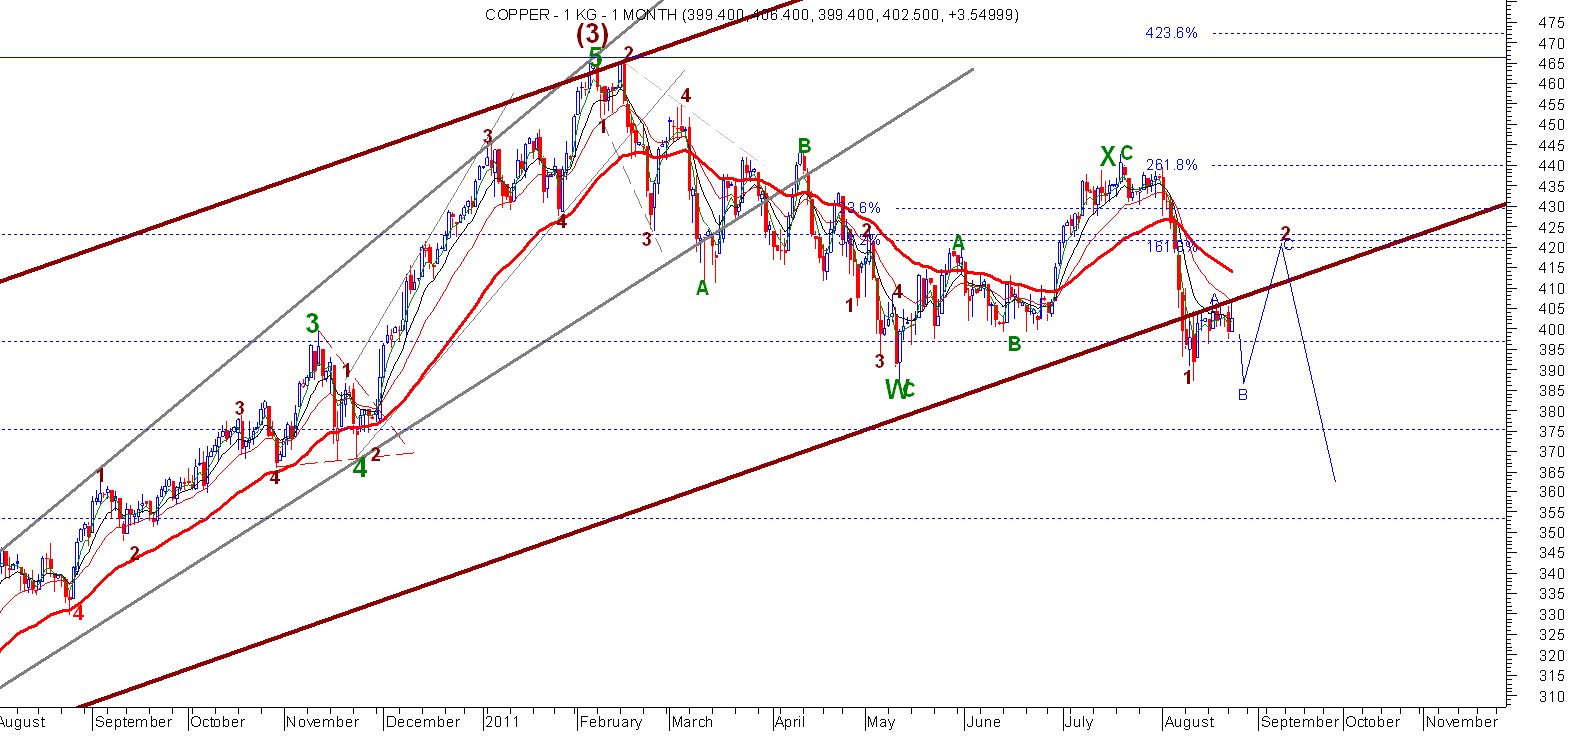
 MCX COPPER
 S&P
S&P
 COMEX SILVER