Saturday, June 4, 2011

Copper

Copper 1hr. chart
Copper daily chart


Copper may go up 415-16 levels which may create H&S pattern and it will indicate for further direction after breakdown from red trend line ( in 1hr. chart ). i will take to short position below the red trend line , not in 416 levels.

Thursday, May 19, 2011

NIFTY


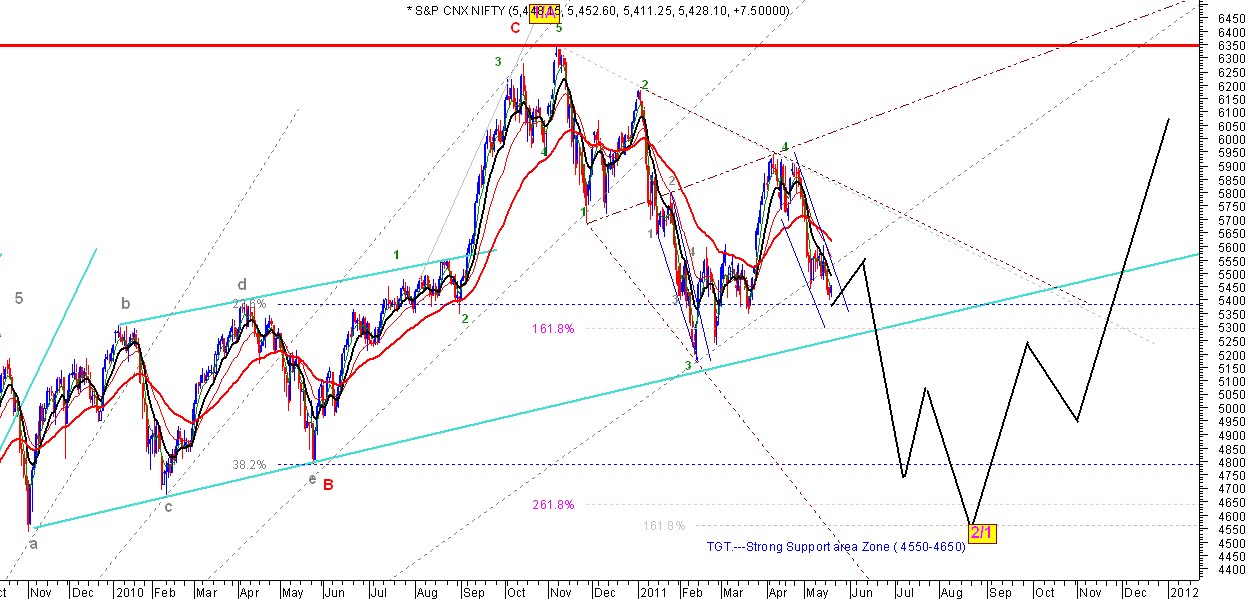
As i told before , nifty should touch 4500-4600 levels onwards. so any bounce back (near about 5600) will be get good opportunity to taking fresh short position .

But question is what will be the longer term direction ?

At last i got the answer according to me , which is --we may see some kind of trading range from 4500-4600 levels to 6300 levels for few months so either side breakout will get clear direction of the longer term trading chart. so u can buy near 4500-4600 levels and sell near 5900-6100 levels then will stay away from the market . And weekly chart indicates Double top near 6300 levels which is longer term bearish pattern , daily chart indicates Cup & Handle pattern ---bullish pattern so we have to wait for further direction .

------Above 6350 tgt. 7200 levels--10000
------Below 4500 tgt. 2200--2400 levels ( after bounce back as i indicated in chart ) .

Tuesday, May 17, 2011

Comex Copper


As i told before copper may be trading in between 390-405/6 levels for few days then fall to levels of 375-377. so at this moment mcx copper- below 397 we may see 393 levels but i am not sure about A wave pattern is 5 wave or 3 wave , if it is 5 wave then copper may be bounce back from 393 levels or 3 wave ---may see 388 levels or below for the B wave of 4th wave.

Comex Gold


Gold---- Since 2009 year we have seen more uptrend pattern from 700 levels to 1575 levels so according to me this entire pattern will be finished near 1575 levels .After that i will be prepare to take short position for ABC pattern which will be the longer term 4th wave after getting conformation. and according to 4hr. chart indicates -- buy above 1517 levels.

Thursday, May 12, 2011

MCX Nickel


After achieved my tgt. in copper by yesterday now i am turn to take sell position in nickel at this levels for the tgt.s of 1040/1020 in 1 or 2 days and ADX indicator is showing strong downtrend may be happened.

Wednesday, May 11, 2011

MCX Copper


According to this chart i think copper should touch 393 levels again as EW theory method so we can create short position below 401 with sl 405.8 tgt. 395/393 levels in coming days .

According to Fibonacci analysis on daily chart 390-92 levels as a strong support, so we may see some kind of pull back after touching this levels to 407-412 .

Saturday, May 7, 2011

NIfty, Nifty 1hr. Chart

Nifty daily chart

Nifty 1hr. chart


I think Nifty has been finished for the 4th wave near 5950 levels. So at this time i think nifty has been prepaired to break down of previous low which is 5170 levels to 4550-4650 levels at near fut. But before we may see some kind pull back rally in nifty 1hr. chart from 5300 levels to 5700 levels which will be wave 1 & wave 2 .

Dot -dot -dot green line is the prediction of further direction.