 still Nickel is in uptrend pattern where others base metal in downtrend pattern as i think so it may touch 1220-50 levels in ahead
Friday, January 21, 2011
MCX Nickel
still Nickel is in uptrend pattern where others base metal in downtrend pattern as i think so it may touch 1220-50 levels in ahead
MCX Copper ,Comex Gold
Comex Gold
 as i told before gold has been turned in downtrend pattern so we may see some kind of selling near 1st support levels
LME Copper Daily chart

MCX Copper daily chart
 MCX copper chart shows bearish according to EW method as well as high volume in yesterday falls ,negative divergence in MACD .
Shangai Index

According to Shangai Index chart pattern indicates bearish from near 2750 levels to 2500 levels which is the the strong resistance
Thursday, January 20, 2011
NIfty 1HR., Reliance
Nifty 1 HR.

i think this is the last fall according to EW theory as well as other indicators also so i would be suggest to buy @ CMP sl 5620 tgt. 5810/5940
Reliance weekly

This weekly chart is trading in a range which i indicated in above chart so at this time i think it may be trading in the range from 900-1040 levels .
Saturday, January 15, 2011
MCX Copper, DOW, US Dollar
US Dollar
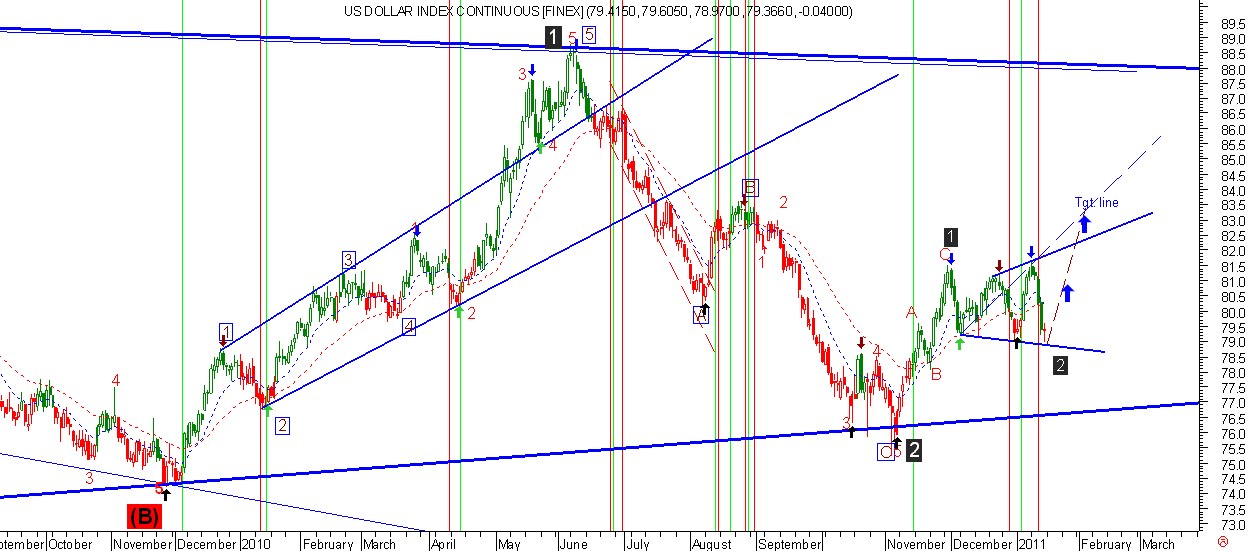 this Broadening Triangle pattern indicates bullish , if this pattern happens the we will see more bullish in ahead
 DOW

This Wolf wave pattern suggests bullish may be completed at any time and should convert in bearish pattern .
MCX Copper
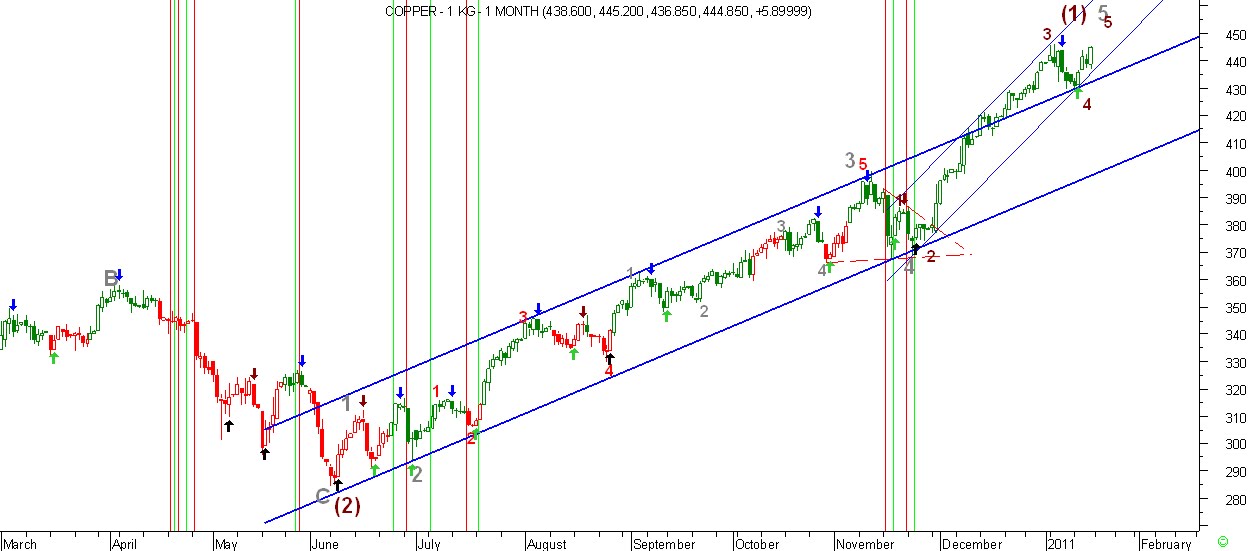 After huger rally from lower levels 290 which is the sign of bullish but at this time All patterns will be completed near 448-51 levels as i think. so i would to suggest square off all long position near this levels. and wait for creating short position
Nifty 1 HR. chart

nifty made new low but i think it should touch 5950 levels in 5 wave pattern as i indicate in chart . so i would to prefer to buy after conformation at lower levels .
Long term----Buy Mode, Mid term---MIX , Short Term---Sell mode, 1 hr.chart---sell mode ( but more chances to do bounce from this levels and convert in buy mode )
so if you are not comfortable to buy then can wait for 5950 levels to go short.
Friday, January 14, 2011
Nifty 1hr. chart

i think right now Nifty may face some kind of fall but wouldn't cross the previous low . if this will be happened then we will see 5950-6000 levels in few days.SL ( today's low)
Subscribe to:
Posts (Atom)