
Thursday, March 1, 2012
NIFTY SPOT 1 HR. CHART
Monday, February 27, 2012
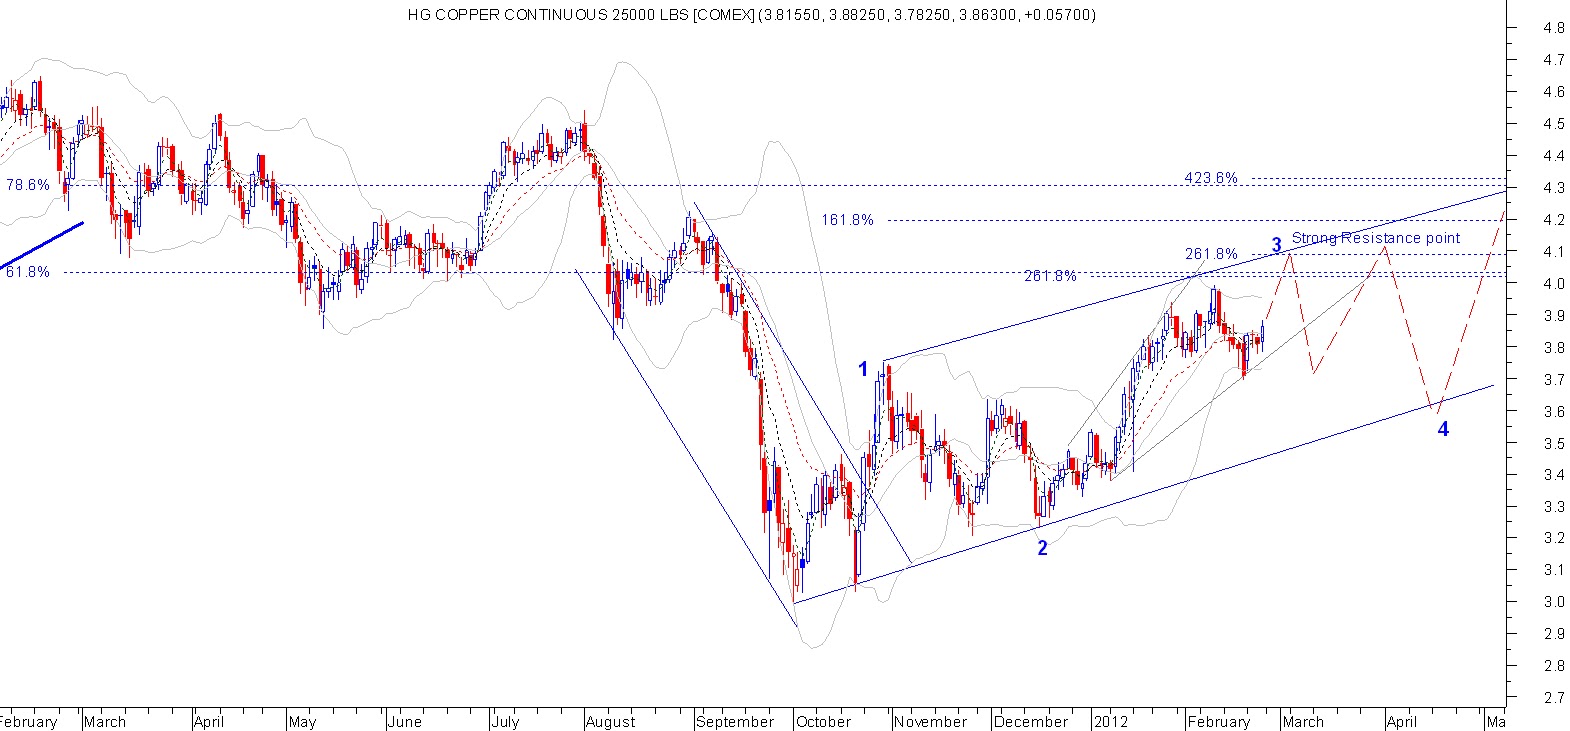
Comex Copper
Tuesday, February 21, 2012
NIFTY SPOT

As we know that Nifty is making HH to HL and it's trading near about 5600 levels . According to fibonacci analysis 5650-5700 is strong resistance point so we have to stay in cautions at this levels to add fresh position . According to my point of view A wave is not still completed yet so we may see some kind of falling moment to completing of 5 wave pattern near 5700 levels then most probability to see a profit booking or downfall pattern at higher levels as i indicated in chart .
I am not running behind the Nifty's trend but looking for a good opportunity to add buy or sell position. but yes when i will get opportunity after completed 5 wave of A wave then i will do short for the TGT. of not sure may be 4900 levels and waiting for negative divergence in RSI daily chart.
U can see --BHEL (TGT.380-390) , INFOSYS-- (TGT. 3260) , Hindalco--- buy near 135-140
Thursday, February 16, 2012
COMEX COPPER, CRUDE, EURUSD, USDINR
 |
| EURUSD |
 |
| COMEX COPPER |
 |
| COMEX CRUDE |
 |
| USDINR |
Comex crude---- Crude price is still trading below my sl levels 103.73 .
i think it should come down 86-87 levels to completing the entire
pattern. if it goes above my Sl levels then could see 112-113 .
EURUSD--- It is trying to make in ABC wave pattern of falling pattern of ABCDE wave to completing 2nd wave .
Comex Copper--- Copper is achieved my TGT. price which is near 4.00
levels and i am looking for some kind of correction pattern in ABC wave
where A wave has been completed and prepares for B & C wave . This
down fall pattern may be completed near 405-400 levels in MCX after
touched 424-425 levels, in COMEX near 3.6 levels
Thursday, February 9, 2012
Nifty Spot

Nifty is trading above 5200 levels which means we may see some kind of
consolidate pattern to completing of total 5 wave pattern of A wave then
could see downfall in ABC wave near 4900 levels.But i will create short
position after completed 5 wave.
4900 levels is not a strict advice to buy but hope so to take support near this levels or according to pattern.
4900 levels is not a strict advice to buy but hope so to take support near this levels or according to pattern.
Wednesday, February 8, 2012
ATX, DOW Transport, Shanghai , NYSE
 |
| ATX Weekly Chart |
 |
| Austria (ATX) Daily Chart |
| Dow Transport |
 |
| NYSE Chart |
 |
| Shanghai |
LME--- ALUMINUM ,LEAD, COPPER
 |
| LME ALUMINUM CHART |
 |
| LME COPPER CHART |
 | ||||
| LME LEAD CHART |
Subscribe to:
Posts (Atom)