Thursday, September 29, 2011

MCX Copper
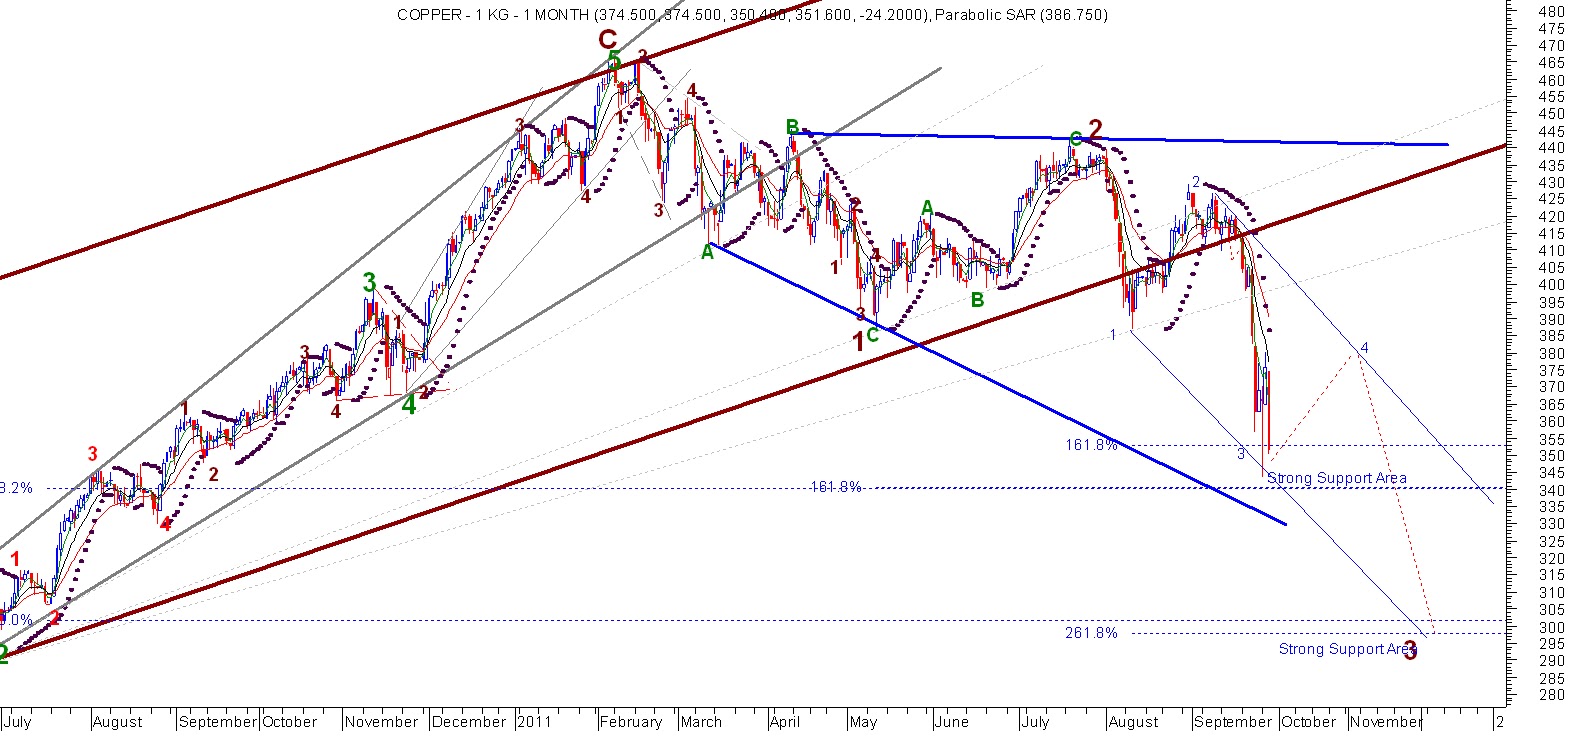
           After Big fall from higher level now it indicates to stop at this time for some kind of consolidate pattern as i think in ABC wave pattern as well as getting Fibonacci Support also near 340-352 levels. and we may see to the upper levels from onwards which could be 380 levels to completing of ABC wave pattern.

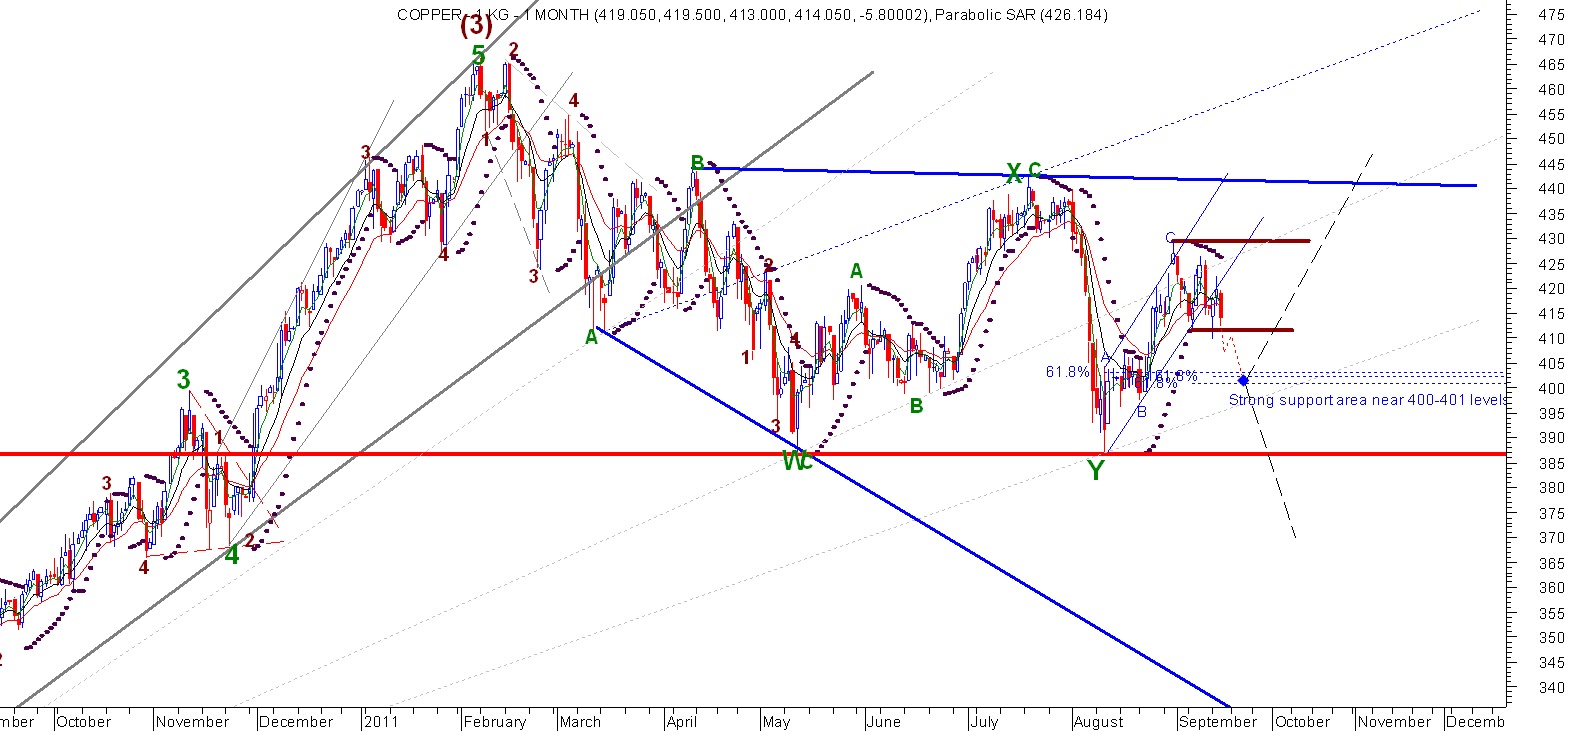
           For the longer range----- As i told before that Copper is trading in 5 wave pattern but if u look on recent low which is near 3rd wave that means it shouldn't trade in 5 wave pattern and could be ABC wave . if it is true then we could see huge downfall after completed the recent 5 wave pattern as i indicated in charts. But yes i am not sure for longer trading range and at this time i am just looking for 300 levels in MCX after completing 4th wave.

Wednesday, September 28, 2011

Nifty, 10 Year Treasury Note, DOW Tranport Avg.

NIFTY Daily Chart

1 HR. Nifty Chart


 Nifty didn't touch 4700 levels but if u look on B wave of C wave it's looking like 5 wave pattern that means C wave may be completed . And now onwards i think price line should not go below previous low which is 4759 then  Breakout above recent high after falling pattern which will indicate for UPTREND.

10 Year Treasury Note
 After Breakdown below 130 levels it indicates 5 have pattern has been completed and now for onwards for ABC wave , so its ultimately effects on other markets for positive bias .

DOW Transport Avg.
Price line has been taken support near Fibonacci support line as i told before so at this time i think it should go for preparation for C wave which should in 5 wave for the uptrend

Monday, September 26, 2011

US Dollar

At this time i think Dollar is leading to all of the commodities as well as Equity market also.so we have to take watch on Dollar index so when this dollar index will get bearish on short term chart then commodities market will grow up . But weekly chart clearly indicates bullish

Friday, September 23, 2011

Nifty,Dow Transport avg. ,10 Year Treasury Note

NIFTY   
 B wave may be completed near 4700 levels or below this levels


DOW Transportation Avg.
 As i told Dow Transport may touch previous low . At this point i think this falling pattern is looking like 5 wave pattern that means it may take support at indicated in chart as strong support area. where RSI,MACD are giving positive divergence .so lets see.

10 Year Treasury Note
At this point Treasury note is the key driver for US market as well as commodity also . if u look on this chart then u will see 5 wave has been completed and waiting for correction as ABC wave pattern so any downtrend will be beneficial for Equity market.

Thursday, September 15, 2011

Comex Gold


This is monthly chart of Comex Gold. which indicates uptrend is still active so at this point i think 4th wave may create ABC wave pattern or Triangle pattern as in indicated in chart then could see uptrend pattern.so lets see.

MCX Copper, Dow Transportation Avg.


MCX Copper


Dow Transportation Avg.

Dow Transportation Avg.----  As i told price line could take support near previous low then rise. so at this moment Bullish candle pattern indicates more bullish ahead with sl recent low which is indicated in black horizontal line in chart. and i think 1st wave may be completed near previous high of C wave then we could see some kind selling pressure at higher levels for 2nd wave . i think C wave should completed near 5100-5150 levels in near term.

MCX Copper-------  Copper price line has been breakdown previous support 411.80 levels which indicates it should touch 400 levels in 5 wave with sl 426.5 as i think. Copper's trend is not clear as we know that still its in bearish mode. if it falls below 387 levels then we will see more down trend pattern . but according to Dow ,EURUSD as well as Nifty all are indicating that price line may fall near 400 levels then rise above 430 levels. if it happens then huge uptrend pattern will see in near future.    

Wednesday, September 14, 2011

Nifty

After 5 wave and A wave completed now its prepare to make for B wave and which may be completed near 4700 levels below 4900. i think nifty should trade in between 4700--5300 levels for 1-2 months. then we will see more downtrend pattern. at this time i am going to make short position below 4900 levels for the tgt. of 4700 then square off all short position and wait for long position at lower levels.