Thursday, May 12, 2011

MCX Nickel


After achieved my tgt. in copper by yesterday now i am turn to take sell position in nickel at this levels for the tgt.s of 1040/1020 in 1 or 2 days and ADX indicator is showing strong downtrend may be happened.

Wednesday, May 11, 2011

MCX Copper


According to this chart i think copper should touch 393 levels again as EW theory method so we can create short position below 401 with sl 405.8 tgt. 395/393 levels in coming days .

According to Fibonacci analysis on daily chart 390-92 levels as a strong support, so we may see some kind of pull back after touching this levels to 407-412 .

Saturday, May 7, 2011

NIfty, Nifty 1hr. Chart

Nifty daily chart

Nifty 1hr. chart


I think Nifty has been finished for the 4th wave near 5950 levels. So at this time i think nifty has been prepaired to break down of previous low which is 5170 levels to 4550-4650 levels at near fut. But before we may see some kind pull back rally in nifty 1hr. chart from 5300 levels to 5700 levels which will be wave 1 & wave 2 .

Dot -dot -dot green line is the prediction of further direction.

Friday, April 15, 2011

MCX Copper


As i think 5 wave pattern has been completed near 467 levels now it's turn to for ABC correction , which i think it should be completed near 375-77 levels in near days . But if i look on Daily as well as One HR. charts are indicating upward rally may be happened till the levels of 430-33.

so at this moment, i am just waiting for conformation to buying and i will be neutral after reached near 430 levels .

Then i will be wait for buying above 445.15 ( which is recent high ) and short below --which will be the recent low , may be 415 levels
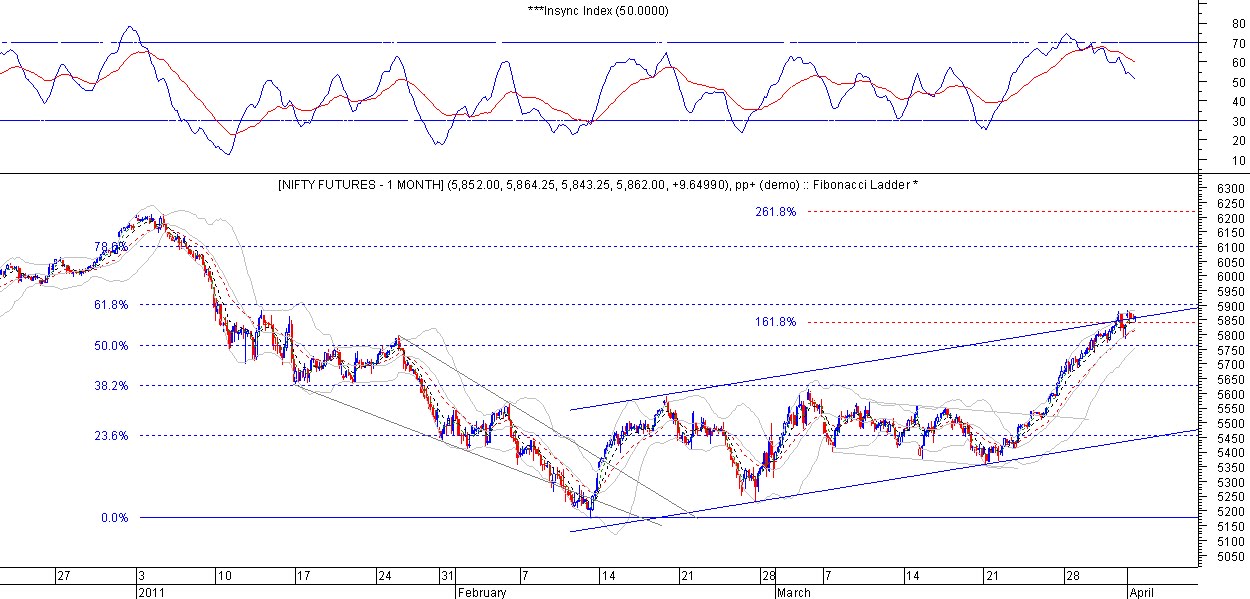
Thursday, April 14, 2011

LME Copper


This inverse H&S pattern type of chart indicates bullish near 10600 levels on LME . and at this levels i would suggests to buy near 422 sl 415.3 tgt. will be update. but 1hr. chart doest not indicate to buying at this levels due to conformation .

Friday, April 1, 2011

NIFTY fut.1 hr. chart


According to Insync indicators we may see some kind of selling pressure at this levels with fibonacci resistance near 5900. but lower levels will be the very good buying opportunity

Thursday, March 31, 2011

MCX Copper


now it's turn to bearish for the tgt. of 392-397 levels in short term in 5 wave method as i indicated in chart