Thursday, March 31, 2011

MCX Copper


now it's turn to bearish for the tgt. of 392-397 levels in short term in 5 wave method as i indicated in chart

Thursday, March 24, 2011

NIFTY


According to this pattern , i think nifty is making Continuous Triangle Pattern which is showing Bearish . so at this time we may see some kind of selling pressure then rise till the 5650 levels and dot dot black line is the prediction of next move.

Thursday, March 17, 2011

NIFTY


This time NIFTY is taking support near 5400 levels at weekly chart according to fibonacci analysis. in daily chart -MACD indicates some kind of bullish above 5565 levels to 5800 levels. so at this time price line is being trade in between trading range thats why we are in upper stage of the trading range.

Double top in weekly chart indicates bearish for longer term . but i am not sure because 5 wave pattern may be completed near 4700-4800 levels according to fibonacci strong support levels.

so lets see.

Wednesday, March 16, 2011

Comex Crude


After sharp fall from higher levels now its turn to pause some time as i think ,because daily chart indicates rise trend still alive so we may see some pullback from this levels as i indicated in above chart .

Friday, March 11, 2011

NIFTY


Near 5600 levels nifty is showing Double top as well as crossover in 50 & 200 MA in daily charts indicates fresh bearish mode may be happened with sl 5620 tgt. 5360 and below 5280 tgt. wil be 4800/4500 in near term

so better to add fresh shorting position instead of buying position at this levels with sl 5620 .

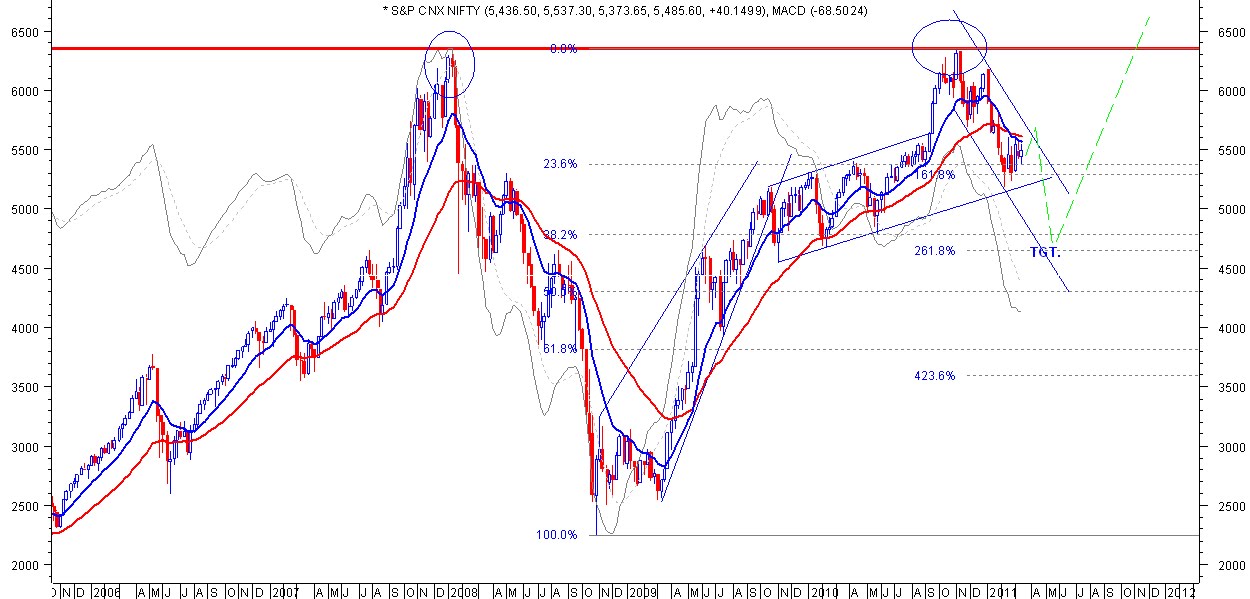
And one more thing i want to say ,if u look on nifty weekly chart near 6300 levels which is showing double top that means future trend may be worst than before .

Thursday, March 10, 2011

MCX Copper


Copper priceline has been touched previous low & H&S pattern are indicating bearish from this levels to 410-407 so any bounce back to get opportunity to creating short position.